|
Eager Space | Videos by Alpha | Videos by Date | All Video Text | Support | Community | About |
|---|

LDEF framework crater analysis
https://sci-hub.se/https://www.sciencedirect.com/science/article/abs/pii/027311779390571R
Orbital debris database
https://orbitaldebris.jsc.nasa.gov/library/HOOSF_16e.pdf
Zerua orbitalal simulator
https://www.zerua.space/
Welcome to Eager Space...
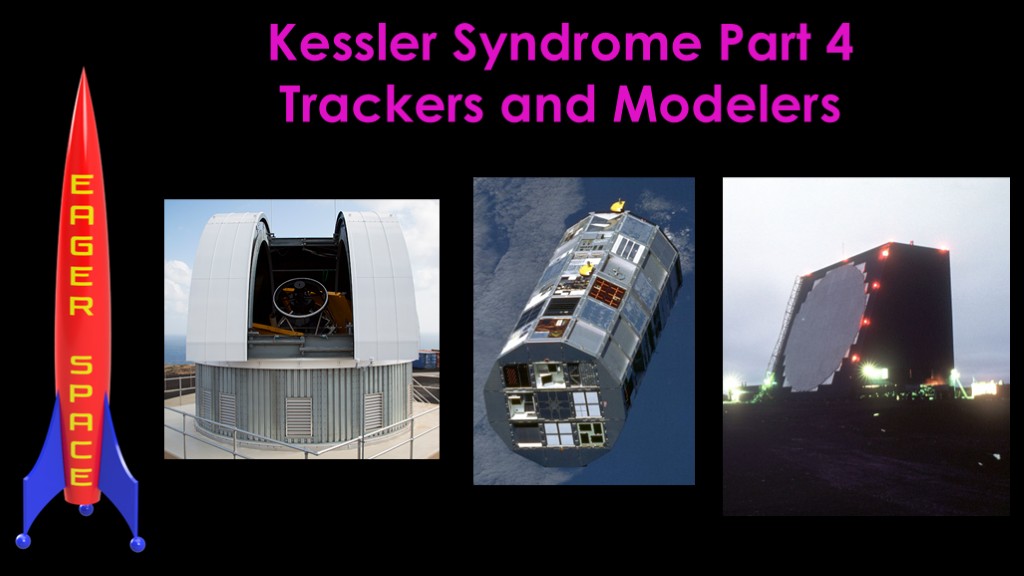
This is episode 4 where we will look at how satellites and debris are tracked and how that data is used to predict their future paths.
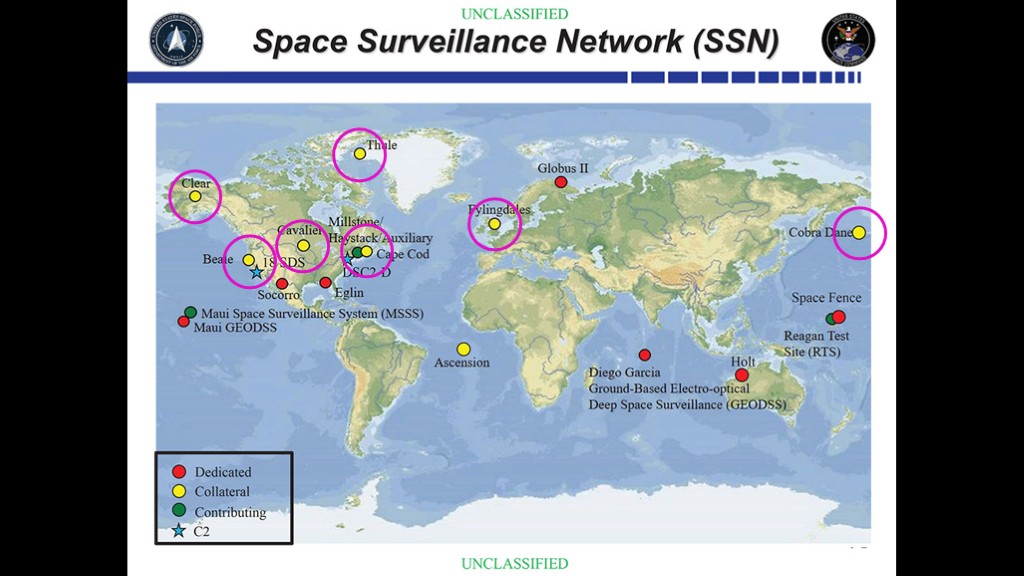
This is the US Space Surveillance network - or at least the *public* ground-based parts of the network. Red dots are sites dedicated to the network, yellow dots are multi-use, and green dots contribute data to the network.
The network was originally created to track ballistic missiles.
These circled yellow dots all use large phased array radars.
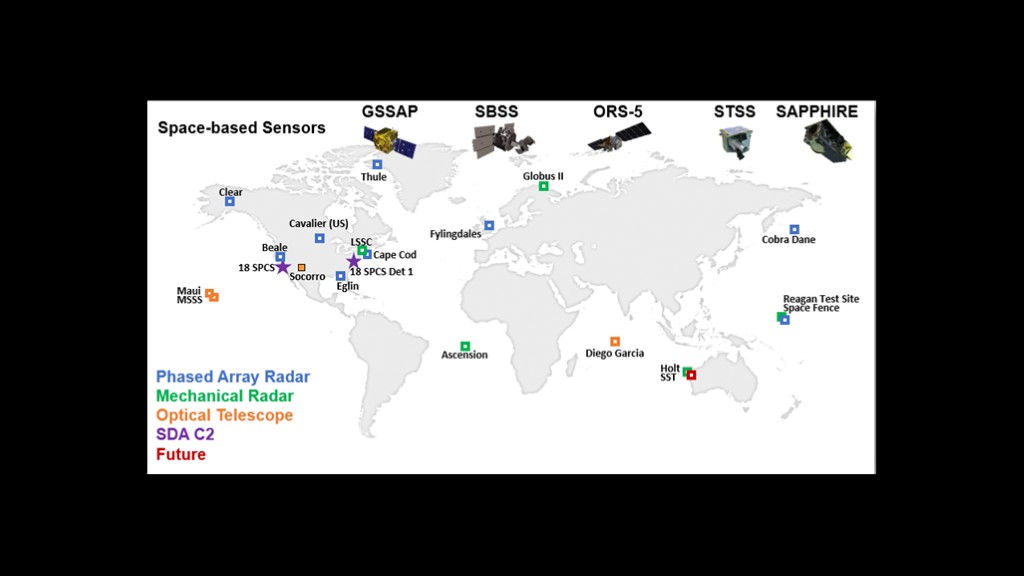
GSSAP - geosynchronous space situational awareness program
SBSS - Space Based Space Surveillance. USA 216 / COSPAR 2010-048A. 30 cm telescope 2.4 megapixel image sensor.
ORS-5 - Small satellite to image geostationary belt satellites as a stopgap until SBSS block 10 is launched.
STSS - No longer in orbit
SAPPHIRE - Canadian satellite launched in 2013.
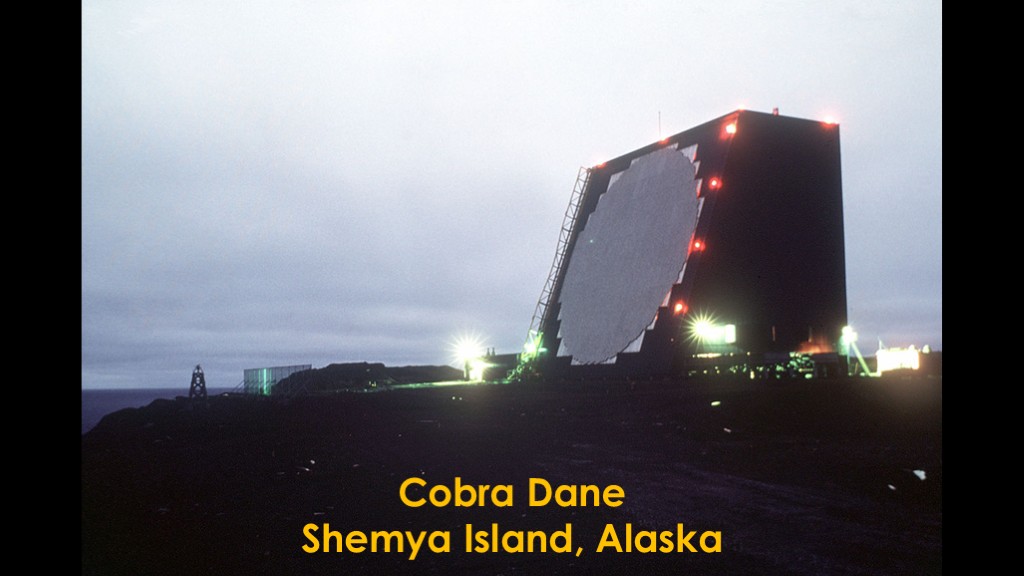
They are very big radar installations, such as the cobra dane installation on Shemya Island, Alaska.
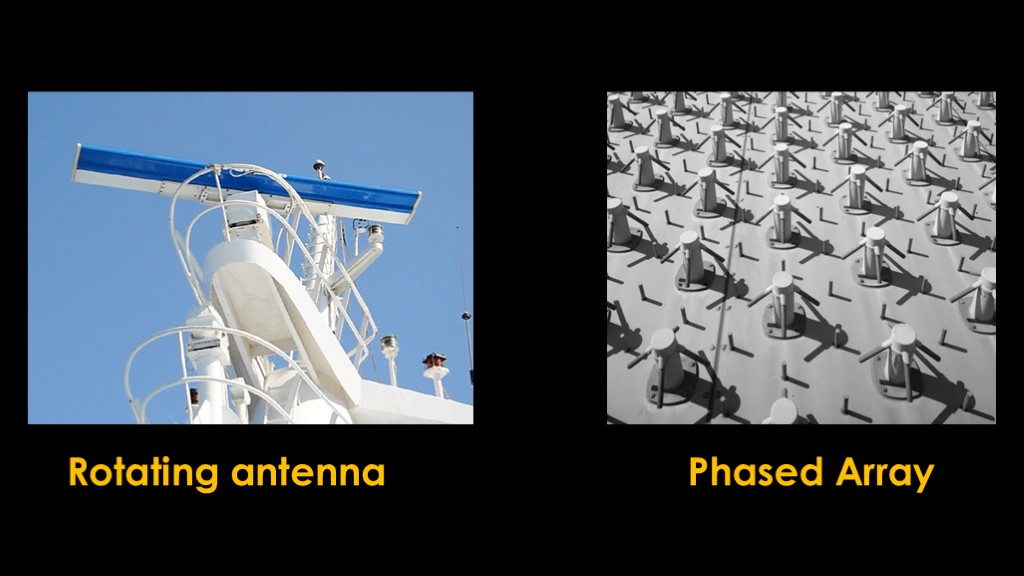
You may have seen rotating antenna radar on ships. They are very good at providing 360 degree coverage, but their size is limited because they rotate around, and that also limits the amount of power they can use and therefore their detection range.
Phased arrays use a flat one or two dimensional array of transmission and reception cells.
Looking at the 1 dimensional case, if we pulse all of the elements at once, each of the elements will send out a bit of energy and those pulses will combine to give us a high energy pulse headed in one direction.
The pulse is high energy, but a pulse that only points in one place isn't very useful.
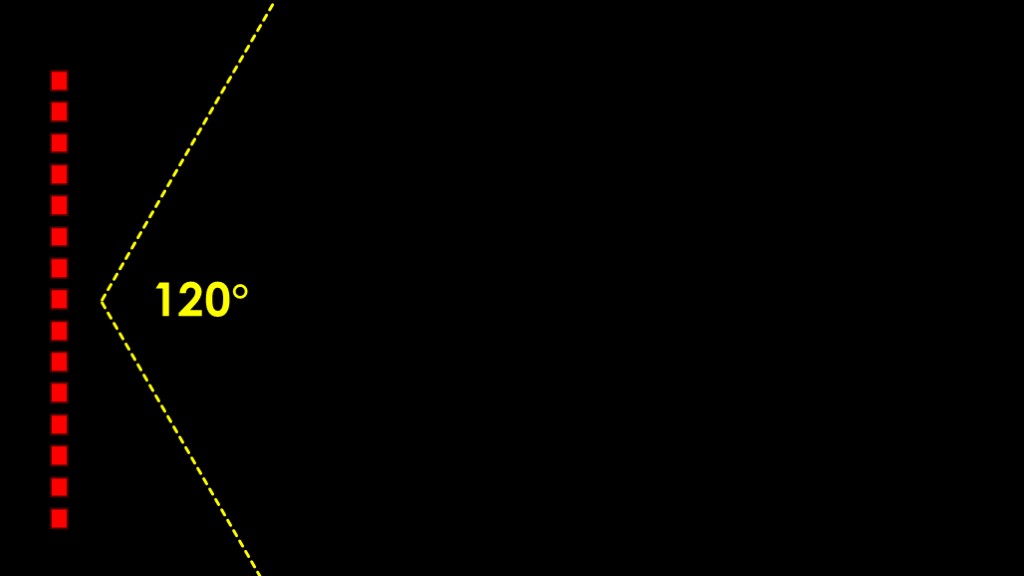
But if we pulse them sequentially, the individual pulses combine based upon when they occurred, and we get a pulse that is at an angle to the radar.
Phased array radars typically allow the radar beam to be steered 60 degrees to each side, or 120 degrees of coverage.
It's also possible to divide the elements into sections and use them independently.
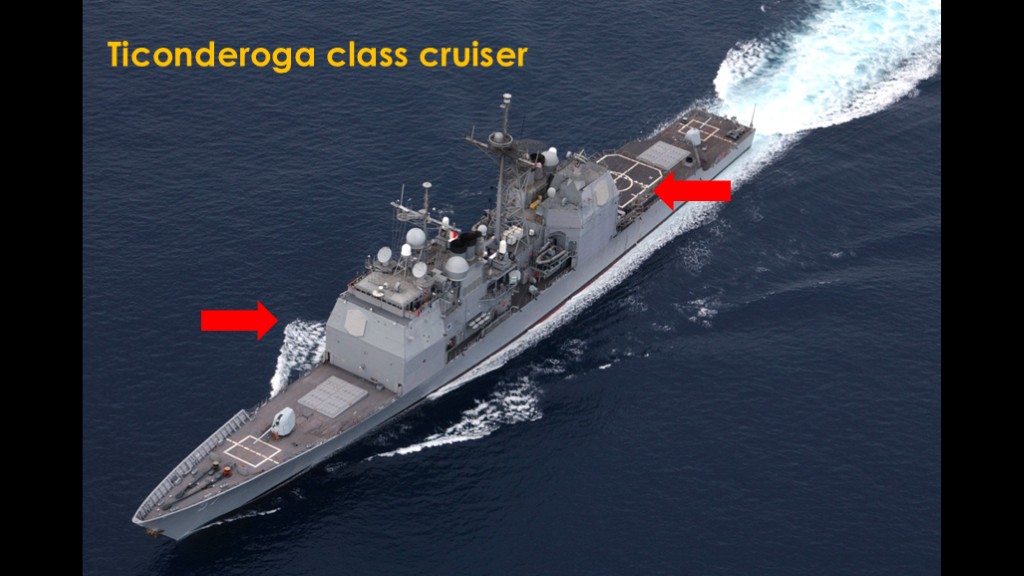
Phased arrays are common in military applications.
The US Navy's Ticonderoga class cruisers have phased array radars on all 4 sides.
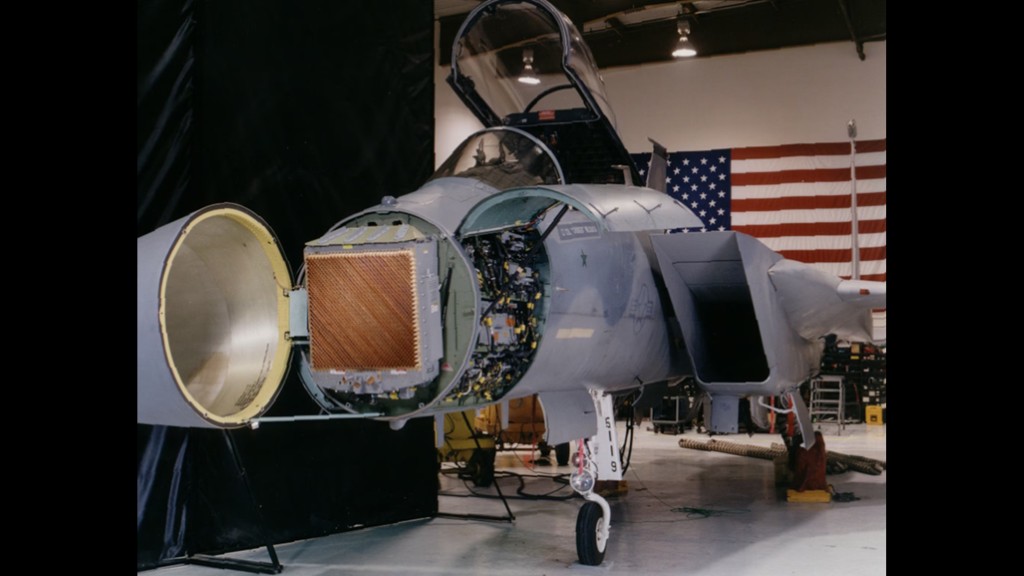
This F-15 eagle has a phased array radar on the front.
The problem is that phased arrays are expensive. Instead of one radar transmitter and receiver, every element has the electronics to both send and receive radar signals. An aircraft radar like this might cost $5 million.
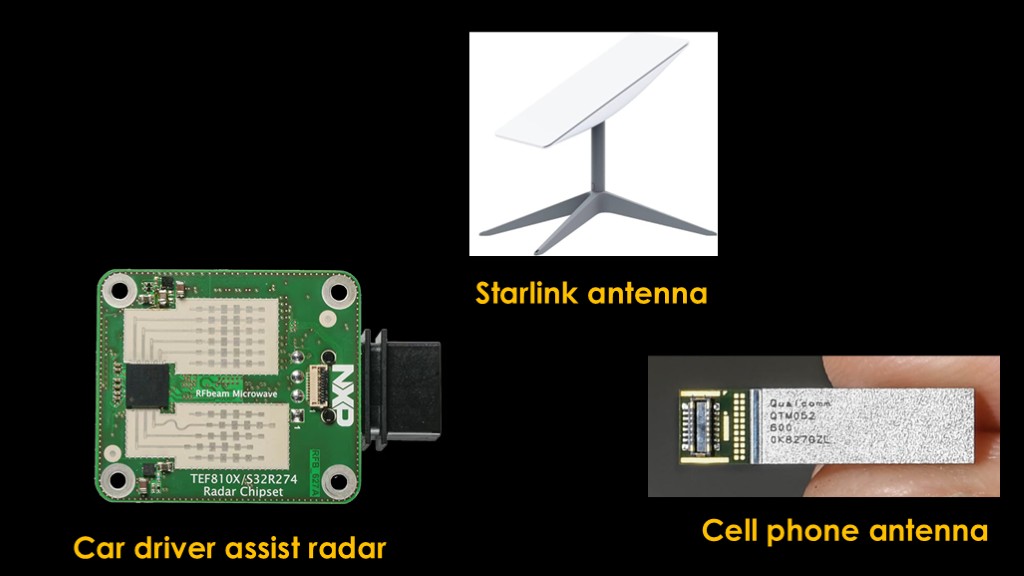
Electronics continue to get cheaper. You've likely heard that the starlink home station uses a phased array radar, and they can also be found in automobile driver assist applications, and qualcomm has developed a 5G cell phone antenna that uses phased array technology.
That's enough about the tech.
Back to the US surveillance system.
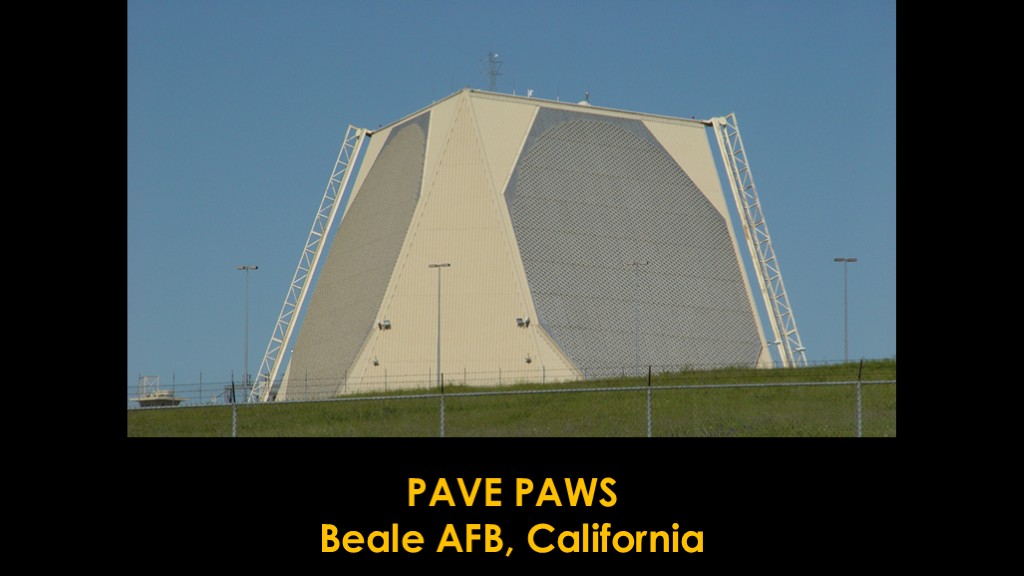
This is Pave paws, a two sided phased array radar located at Beale Air force base in California.
Like cobra dane, the radar array is nearly horizontal which means it's not looking up, it's looking sideways towards the horizon.
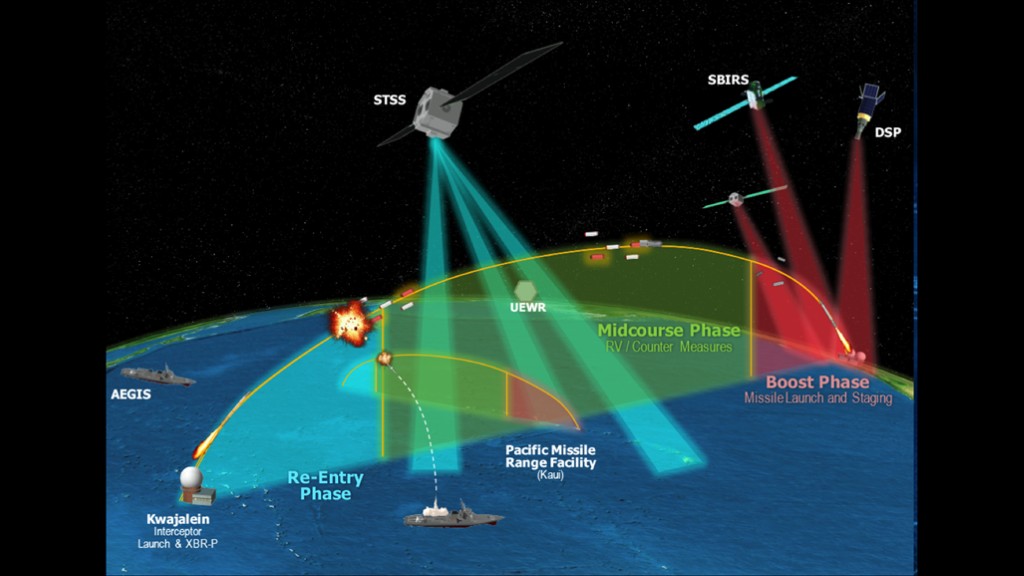
These large radars are aimed at the horizon to detect ballistic missiles as they come over the horizon - that is their primary reason for existing.
It just turns out that if you have a very large - and therefore very sensitive - phased array radar that is in continuous operation, you can also use it to track objects in orbit.
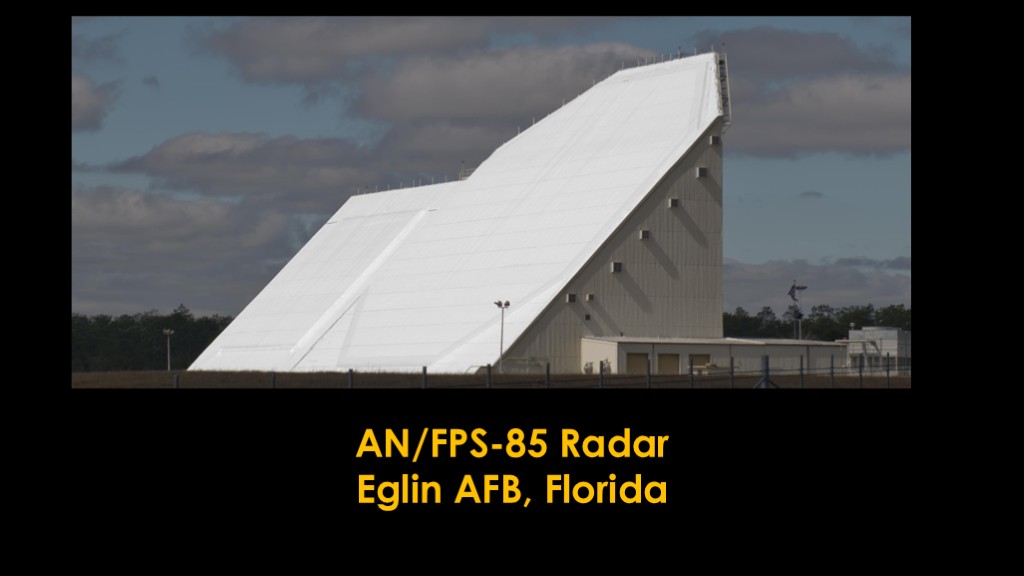
This large phased array radar at Eglin air force base in florida is dedicated purely to orbital tracking, and it's roughly aimed at the geostationary belt above the equator.
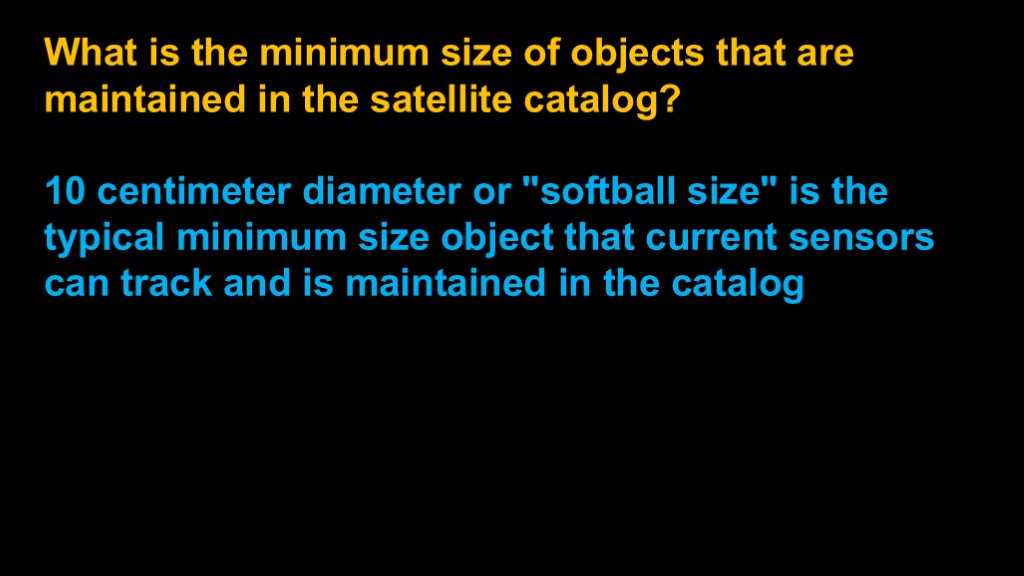
Throughout this series, I've said that 10 centimeters is the minimum size object that is tracked, and the Space-Track.org website confirms that number.
The first reference I could find to that number is in a 1987 paper referencing a 1984 paper that is unavailable. It says the following:
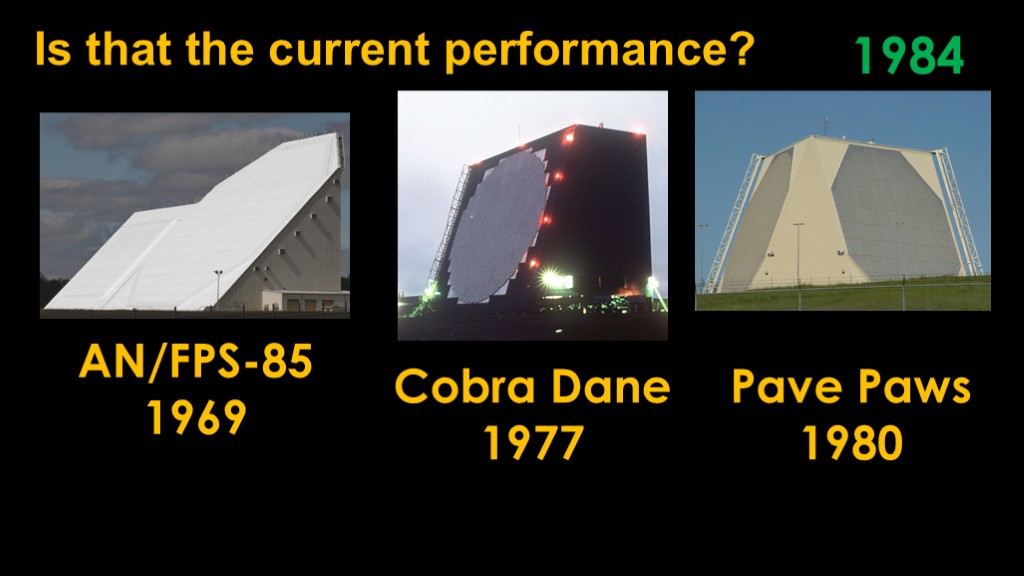
That makes me wonder whether that's the current performance?
1984 was a long time ago. But... if we look back, we see that the AN/FPS-85 in Florida dates to 1969, Cobra Dane dates from 1977, and pave paws dates from 1980.
I guess is wouldn't be very surprising if performance isn't any better.
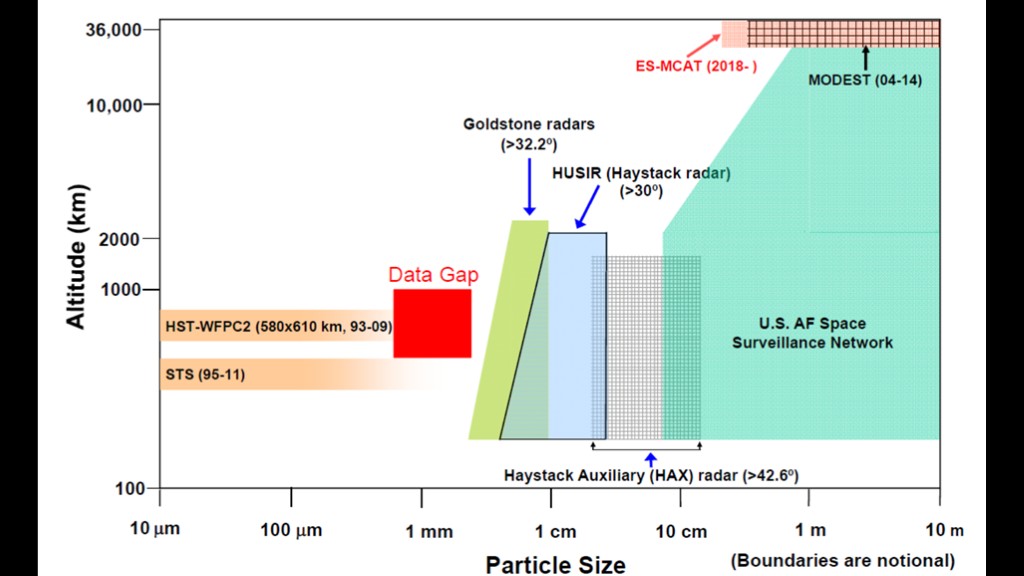
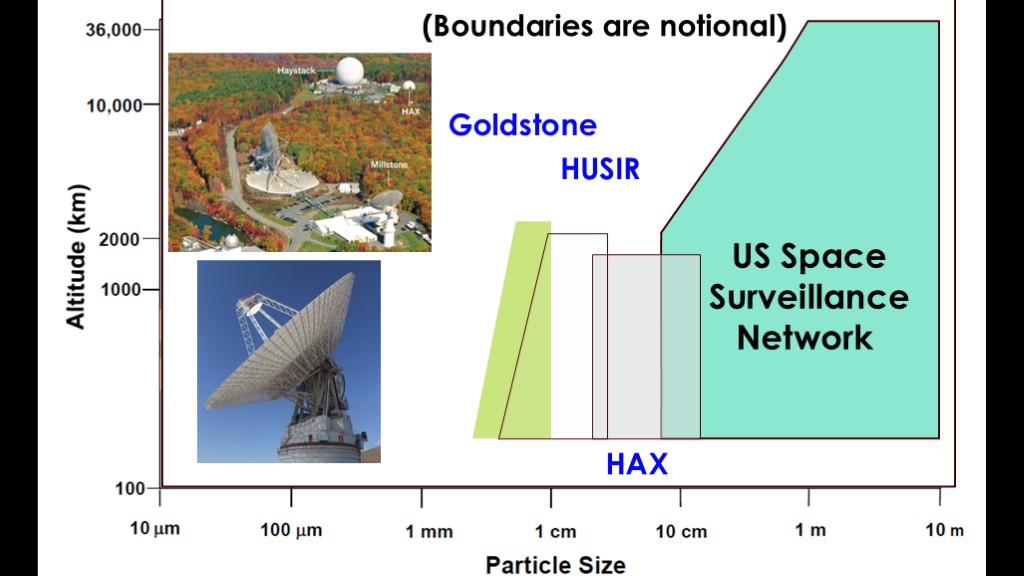
Which brings me to this chart, which shows the performance of the US space surveillance network across different particle sizes. That shows the 10cm lower limit the current systems have when it comes to tracking. The system can detect 10 cm objects to the top of low earth orbit at 2000 kilometers and its performance drops off at higher altitudes and it can only detects 1 meter objects at geostationary altitudes.
That is not unexpected with a radar - the strength of the radar pulse and the reflection from the object decreases as the distance is greater. I would also expect the performance to be better at 400 km than at 2000 kilometers, but the chart I took this from doesn't show it.
There is a helpful annotation that says "boundaries are notional", where notional means "theoretical or speculative", so it's not showing the actual performance.
Below the 10 cm notional boundary, there are three additional radars that give us information on smaller objects.
The MIT Lincoln space surveillance complex in westford Massachusetts - yes, the location that gave us the west ford needles - hosts the "haystack" HAX and HUSIR (who-zew) radars, both using conventional dish radar antennas. The large radio antennas at NASA's goldstone deep space communication complex in California are also used.
These radars are used to gather population data on orbital debris, but they do not track individual objects.
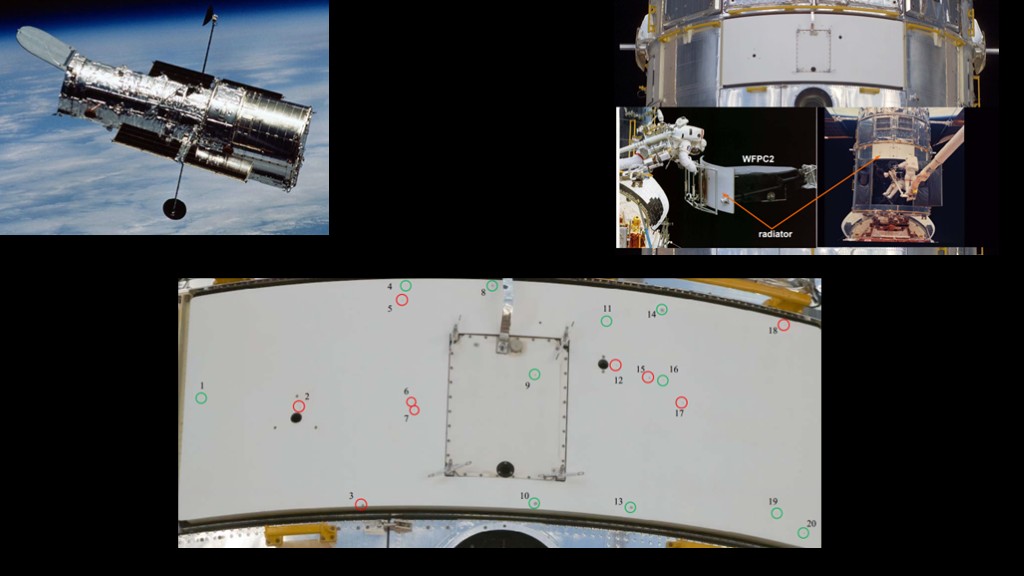
NASA has done some analysis of smaller object populations based on objects that have spent a lot of time in space.
One study uses an instrument from the hubble space telescope.
The wide field planetary camera 2 was installed during a servicing mission in 1993, and when it was replaced in 2009, the old camera was returned for analysis. NASA identified 685 impact craters on the camera's exposed radiator, none of which penetrated the surface.
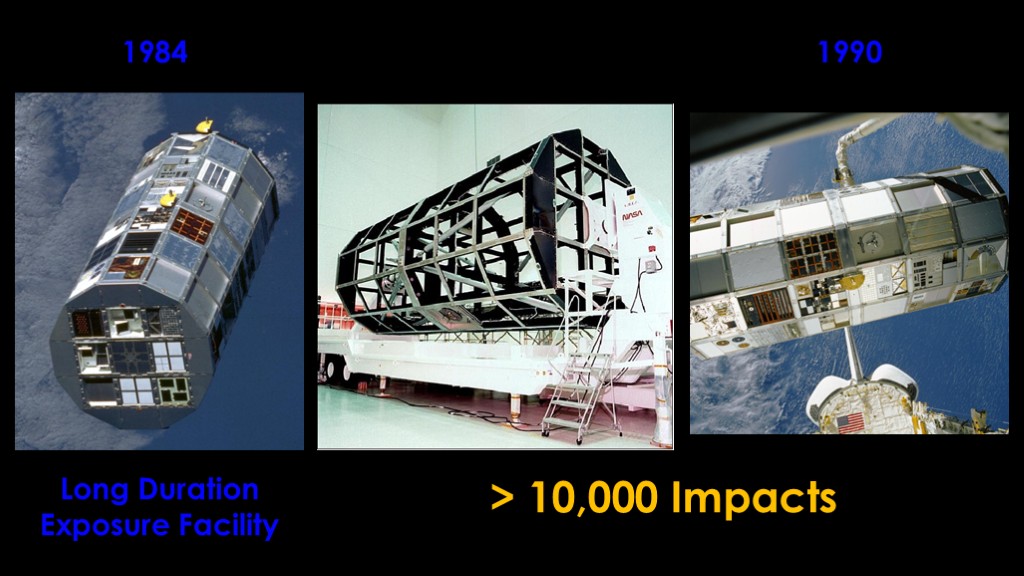
In 1984, NASA launched the long duration exposure facility, a satellite designed to expose a wide variety of materials to the low earth orbit environment for about a year.
Because of a series of delays - including the loss of Challenger - it wasn't retrieved until 1990, nearly 6 years later.
NASA looked at the rectangular framework that held the material panels and identified more than 10,000 orbital debris impacts.
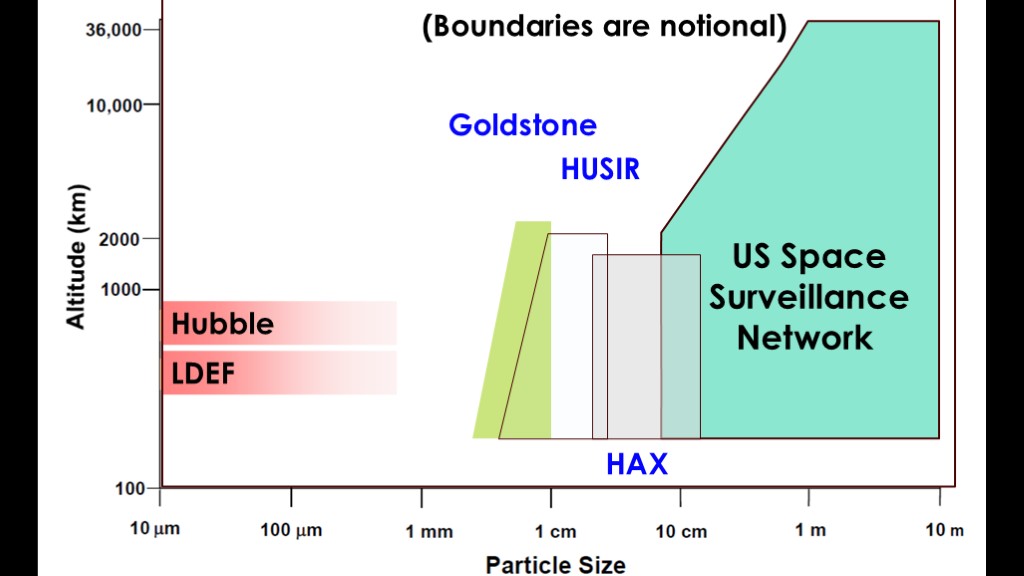
The analyses using Hubble and LDEF therefore give us some information on orbital debris at the smallest sizes.
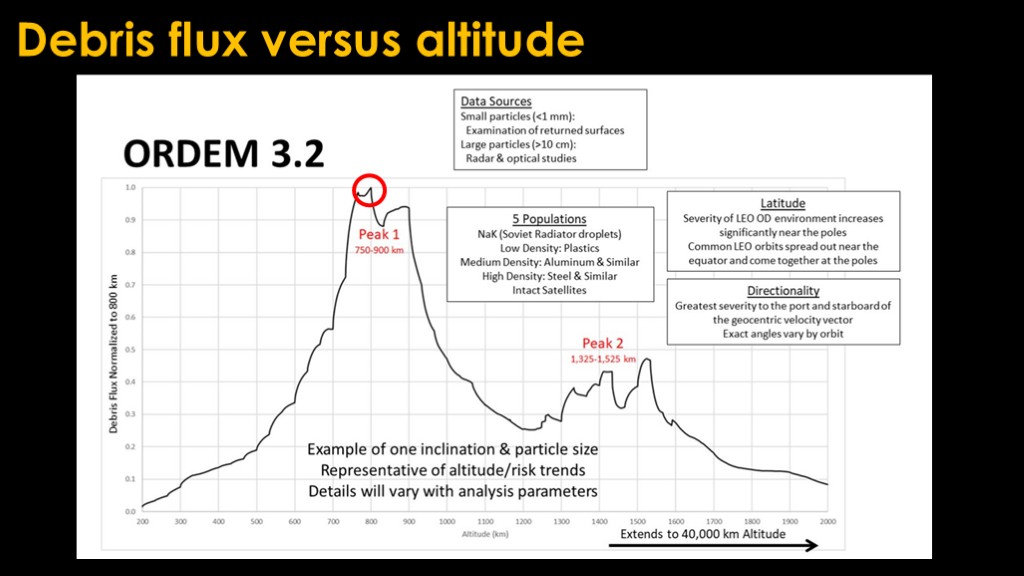
All of the data on orbital debris feeds into NASA's orbital debris modelling program, known as ORDEM.
ORDEM can give take information on the orbit of your spacecraft - the altitude, inclination, and eccentricity - and tell you what the expected debris flux will be for that satellite. This chart is more of an overview - it shows the debris flux at different altitudes.
The big lesson - 800 kilometers is not a happy place to be.
And that's the story on government orbital debris tracking... At least the data available to the public.
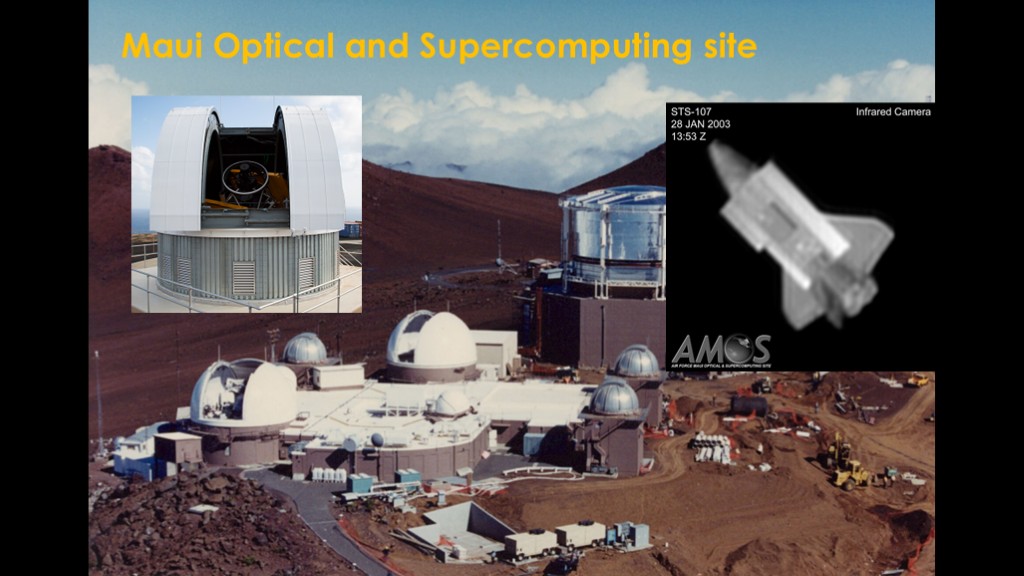
The Air Force Maui Optical and supercomputing site is at the top of Haleakala on the Hawaiian island of Maui, and at 10,000 feet it is above quite a bit of the atmosphere.
It hosts the ES-MCAT telescope, designed to track objects at geosynchronous orbit and beyond. The NASA orbital debris office has used data from this telescope.
It is widely believed that one of the primary uses of this telescope is to image spacecraft. This is an image of the shuttle Columbia from one of the telescopes at this site.
There are other air force optical telescopes at other sites.
But it turns out that we aren't quite done with radar installations yet...
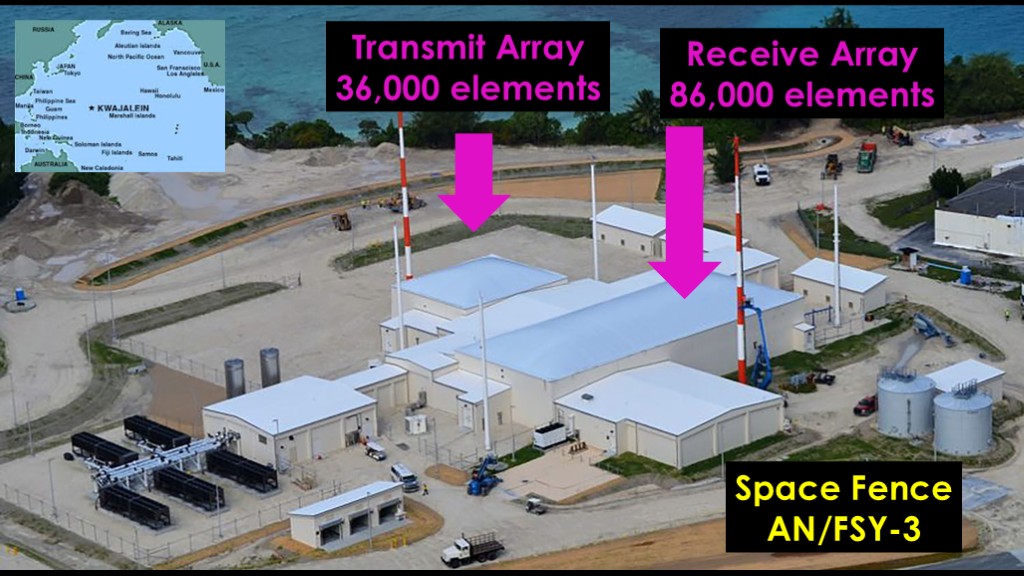
Kwajalein Atoll is northeast of Australia in the Pacific Ocean. This is an excellent site because it is only 8 degrees north of the equator and can therefore see all orbital traffic.
It is known as the Space Fence and hosts the AN/FSY-3 phased array radar. It uses horizontal arrays because it wants to look up rather than at the horizon, and they are very large, with 36,000 transmit elements and 86,000 receive elements.
It - not surprisingly - has better performance than the legacy systems...
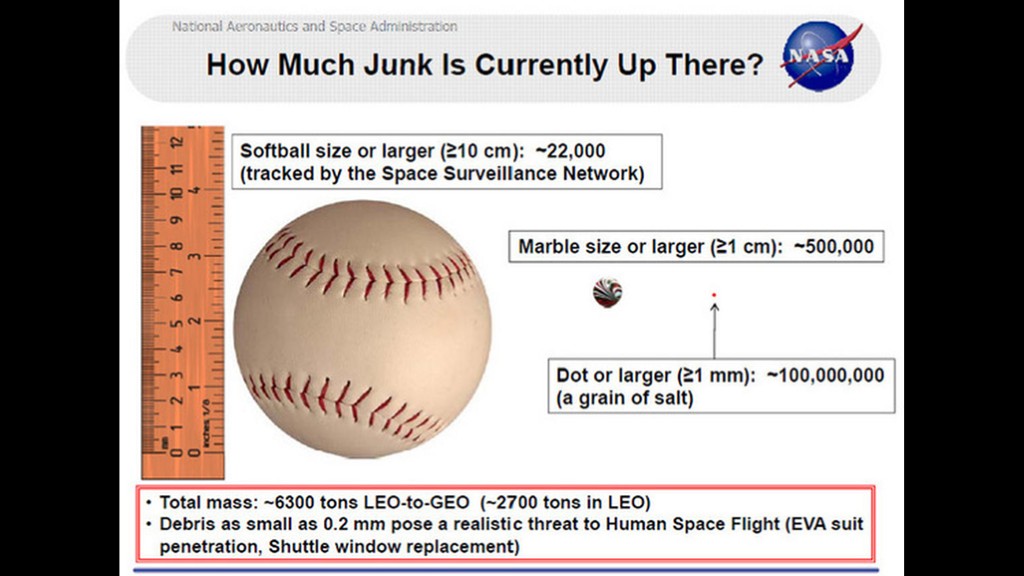
It is reportedly able to track objects roughly the size of a marble, or about 1 centimeter in low earth orbit. The NASA estimate from 2015 is that there are approximately 500,000 objects of that size or larger, a much much larger population than at 10 centimeters and above.
If you want to use this information, you can make a simple request, and the government will tell you "no". There are some reports that they use their full dataset for orbital conjunction prediction.
You might have noted that I specifically mentioned "government" programs earlier.
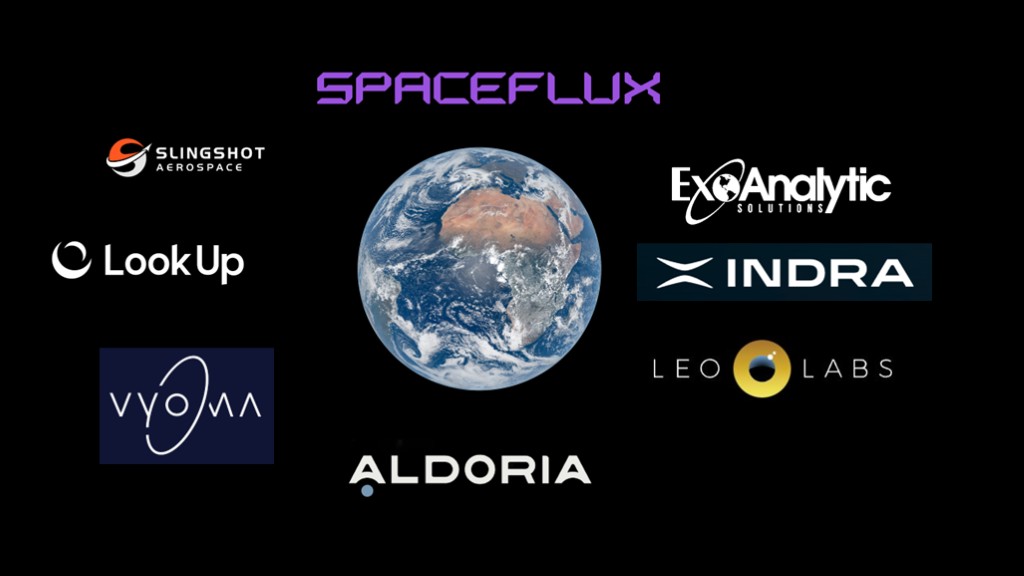
There are a number of commercial companies that are doing orbital tracking. These companies have their own sensor networks that they are using to gather data.
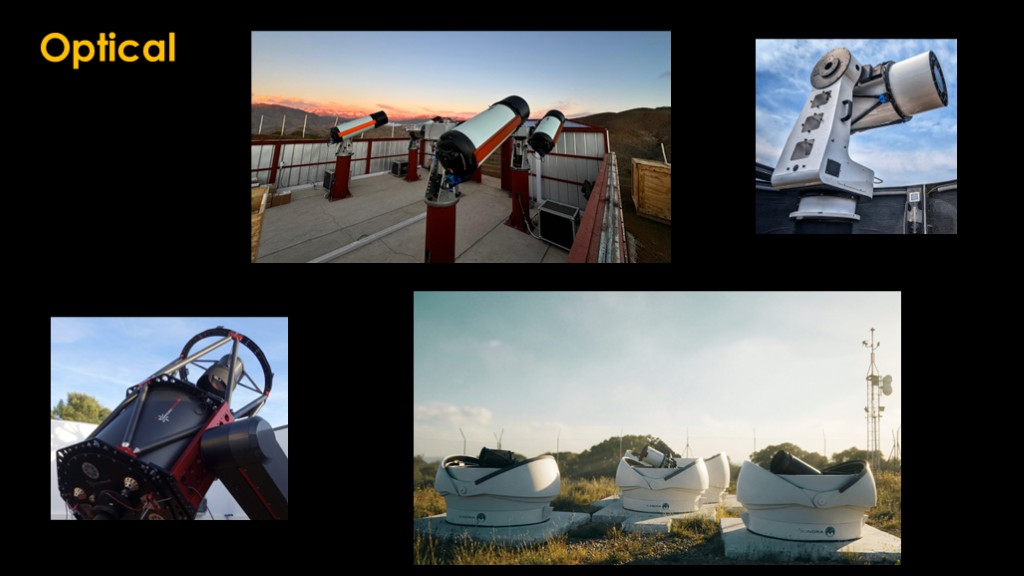
Some companies use optical tracking using single telescopes or telescopes in arrays.
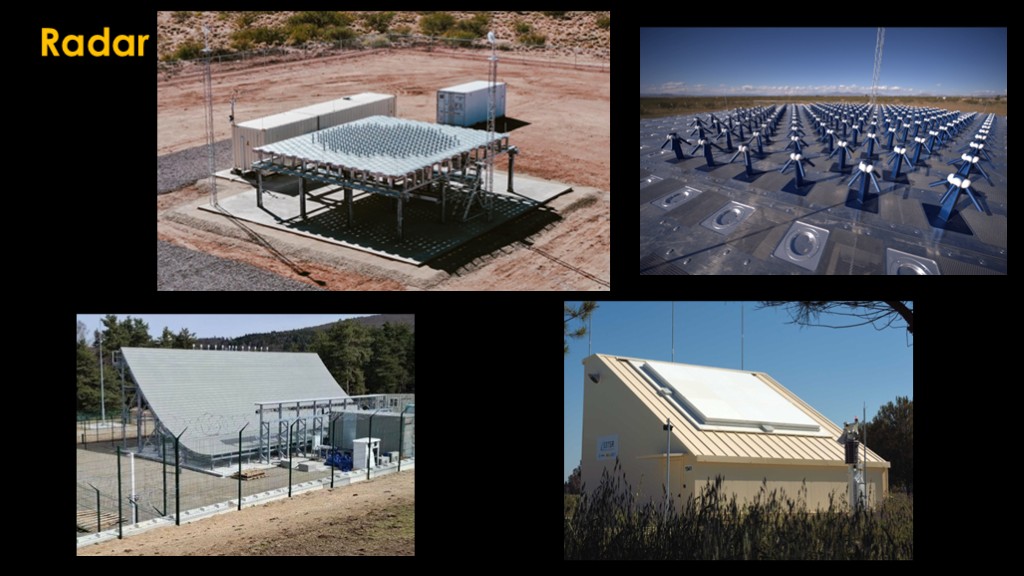
Some use gound based phased array radar, sometimes in one dimensional configurations, sometimes in two dimensional arrays.
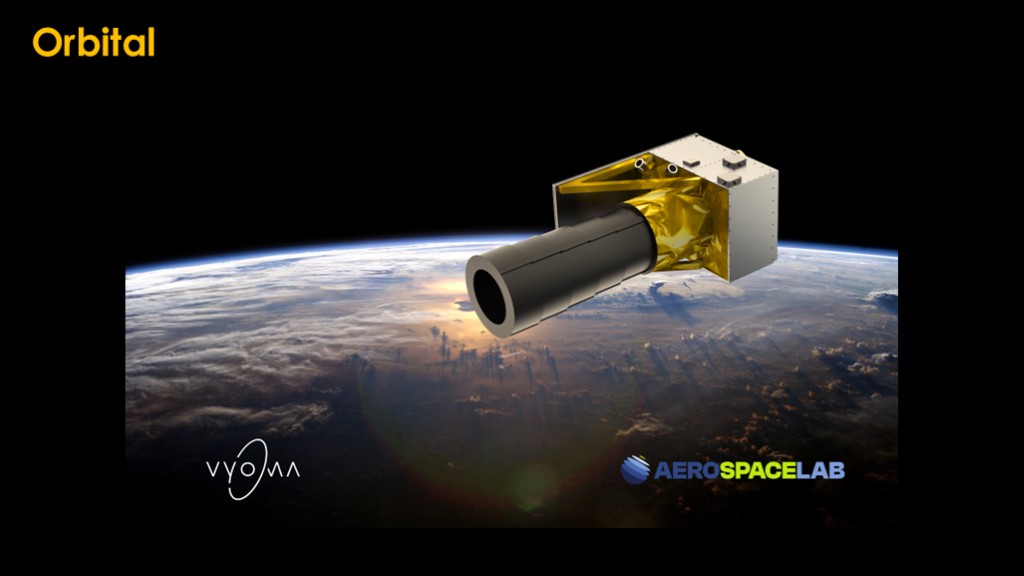
And there are starting to be satellite-based sensors.
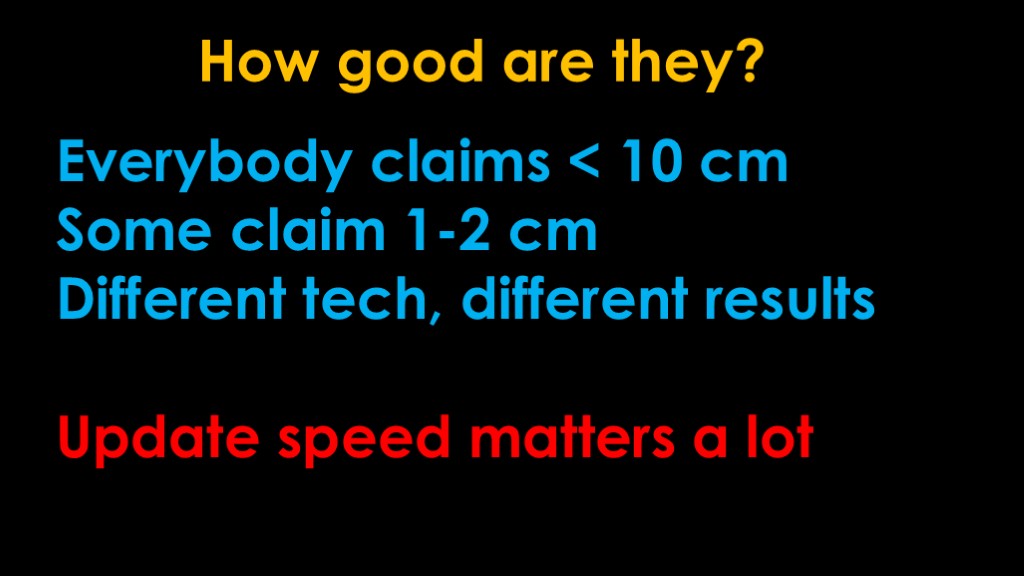
How good are these systems?
It's not very clear.
Everybody claims less than 10 centimeters because that's what the public Space Track data says. Some claim 1-2 centimeters, or they plan to get to 1-2 cm with future equipment.
Different tech has different strengths. Visual light optical varies based on lighting, radar is more consistent.
To be useful, update speed matters a lot. It's not useful to track all 1 cm debris if it takes you two weeks to update your catalog because the future path can't be predicted accurately for very long.
This is still a new industry and I expect to see the usual mergers and exits.
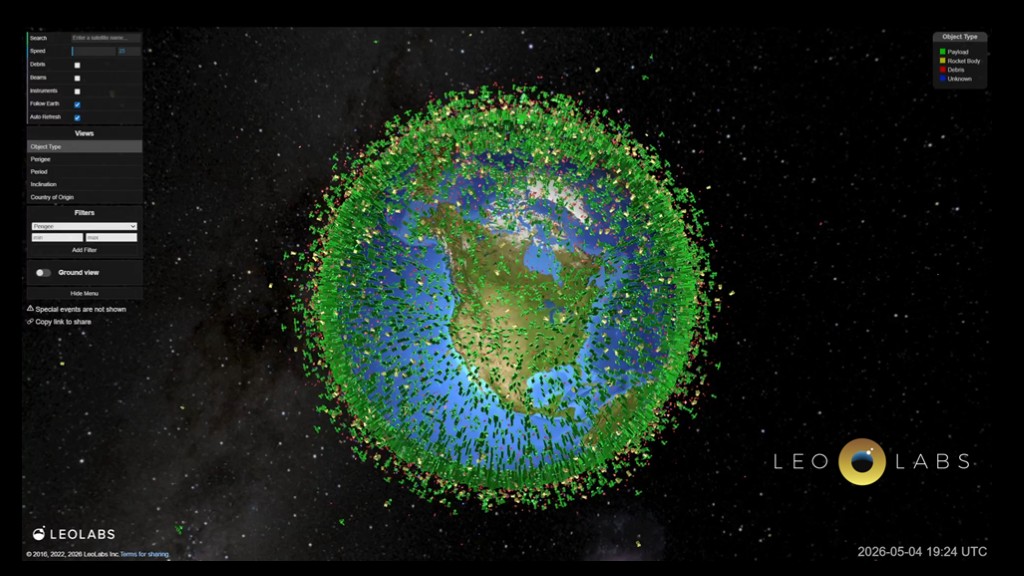
As an example - and so that I can show their very nice visualization page - leo labs says that they are currently tracking 26,566 objects. They claim <10 cm but with their current radars they probably aren't much better than that.
Space track is tracking about 66,000 objects.
That puts leo labs in the same ballpark as space track, so I'd say they are pretty close to 10 cm.
Their stats say that 90% of their objects are updated at least once a day. Decent, but not quite what space track can do.
How good can the commercial companies get?
Everybody is hoping to get to 1 centimeter because there is so much collision potential in that class of object and they are largely untracked at this point.
I'm thinking there is potential for the radar sites to track a lot of objects in the 1-10 centimeter range, and if that data is combined with the optical data, good coverage is possible.
But it's a hard problem.
And then there's starlink...
SpaceX has more satellites in orbit than anyone else by at least an order of magnitude and protecting those satellites is of major importance to them.
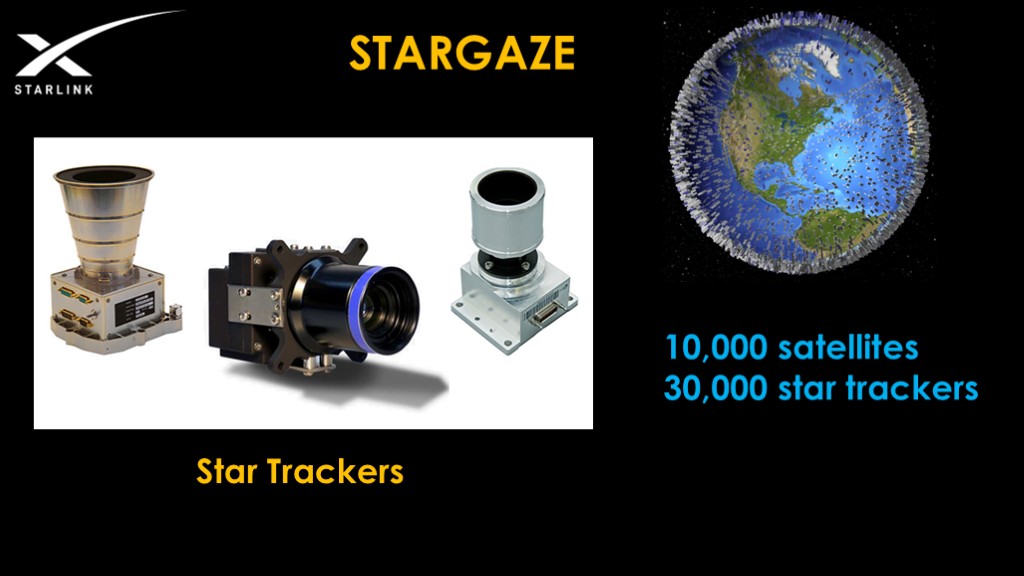
They therefore built their own object tracking system named stargaze.
Pretty much every satellite uses what are called star trackers. They are optical sensors that look at the stars and use the pattern of stars to identify where the star tracker is pointing. Use three star trackers and you end up with a very good idea of the attitude of your spacecraft - where it is pointing and how it is rotated.
Starlink has 10,000 satellites and therefore they have 30,000 star trackers.
The starlink star trackers capture video, so not only can they capture fixed stars, they can also capture moving objects. Objects like other satellites or orbital debris. Put multiple observations together, do a lot of fancy math, and you can track a lot of objects.
And I think this might perhaps be the solution to a puzzle I found earlier in the series.
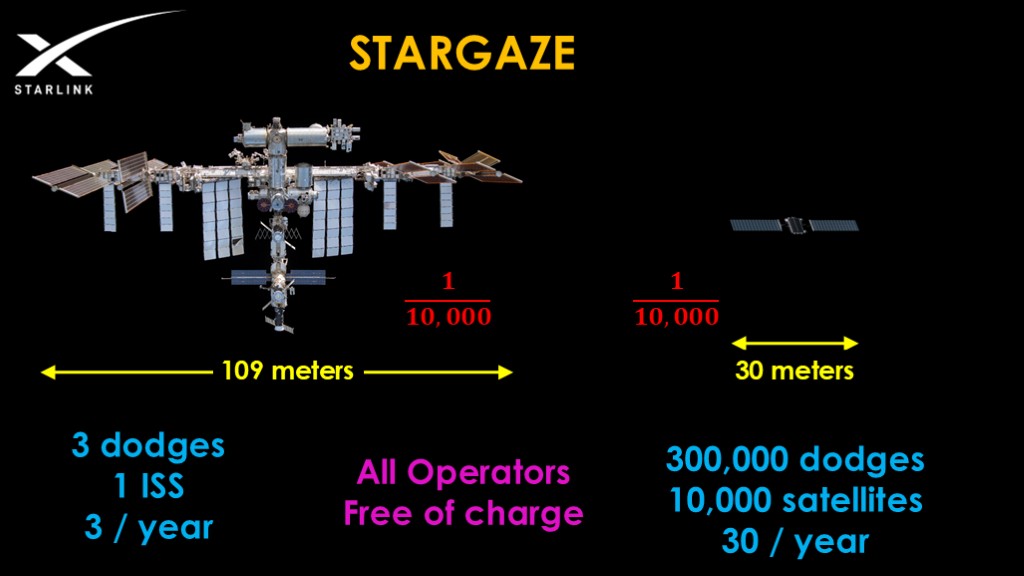
The international space station is about 109 meters long and is very wide. A starlink version 2 has a total length of about 30 meters. Starlinks are much much smaller in area than the ISS.
NASA uses a 1 in 10,000 probability threshold to decide whether they should move crewed spacecraft to avoid debris. SpaceX uses the same 1 in 10,000 probability.
SpaceX reported that they made 300,000 orbital adjustments in the starlink fleet in 2025. Spread over 10,000 satellites, that means about 30 adjustments per satellite per year.
The ISS dodges approximately 3 times per year, and there's only one ISS.
The very large ISS dodges about 10% of the time that starlink satellites dodge.
That's the puzzle.
I can think of a few possible explanations, but one is that stargaze is finding objects in the 1 cm to 10 cm range and SpaceX is using that information to avoid them.
We don't have a lot of information on Stargaze yet, but we do know that SpaceX has said that they will be making the stargaze conjunction data - the result of the analysis of all the objects - available to all operators free of charge. It's not clear how that will affect the object tracking companies.
Now that we have the data, we would like to use it to predict the future path of objects and look for possible collisions
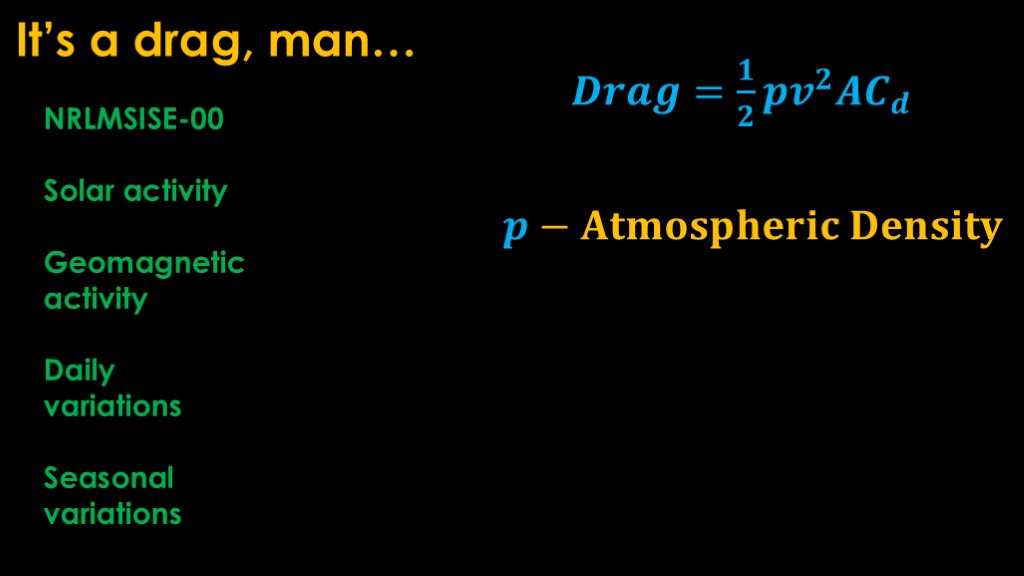
Our first problem is that the area around the earth isn't a perfect vacuum, and we therefore have to figure out what the aerodymic drag is. We can use this simple equation.
It depends on the Atmospheric density.
There is a model known as NRLMSISE-00 which predicts the atmospheric density at different altitudes based on solar activity - the activity level of the sun causes the atmosphere to expand and contract - geomagnetic activity, daily variations, seasonal variations, and other factors.
This model unfortunately can have inaccuracies from 25-50%. There are other models that can produce better results.
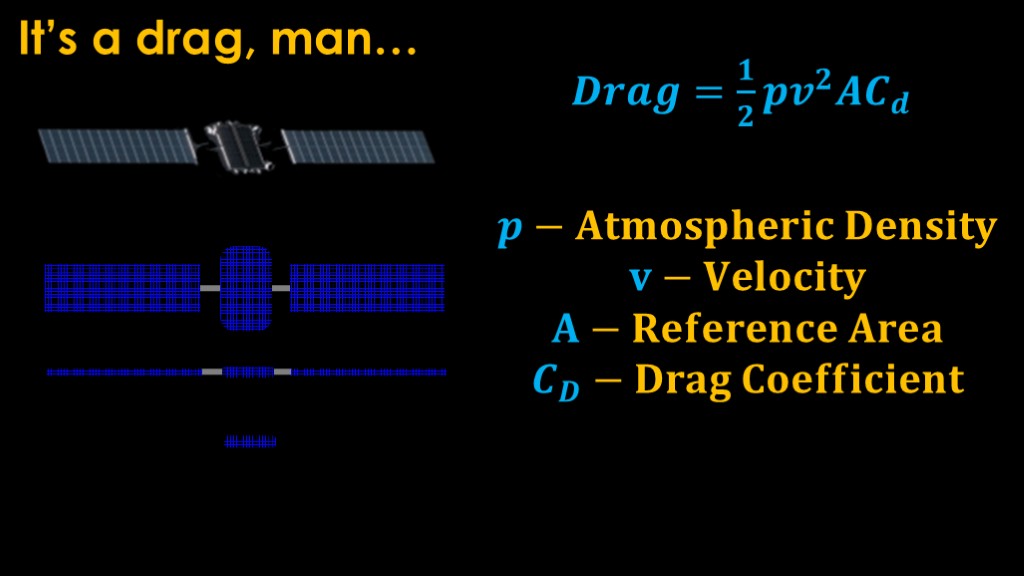
V is the velocity of the orbital object, which seems straightforward, but it's actually the velocity of the orbital object in relation to the atmosphere, and there are atmospheric winds in low earth orbit. You therefore need a model that can compute that velocity for you.
A is the reference area of the orbital object and C sub d is the drag coefficient. Together, these provide another factor in the total amount of drag.
Let's look at the starlink V2...
Let's say the starlink is travelling directly towards us in this configuration, presenting the maximum surface area and therefore having the highest drag.
If it is on edge to the path of travel, it presents a much smaller surface area and therefore much less drag.
And if it is end on to the path of travel, it presents the least surface area, and therefore the minimal amount of drag.
The overall orientation is controlled by the orientation of the spacecraft body to do its job and the orientation of the solar panels to catch the sun. These constraints may change over the course of a day or even during a single orbit as the tradeoffs change - if you are over an area with few subscribers, perhaps you need less power and can put the solar panels in a lower-drag configuration.
All of these factors make it very hard to figure out how atmospheric drag might affect a specific spacecraft.
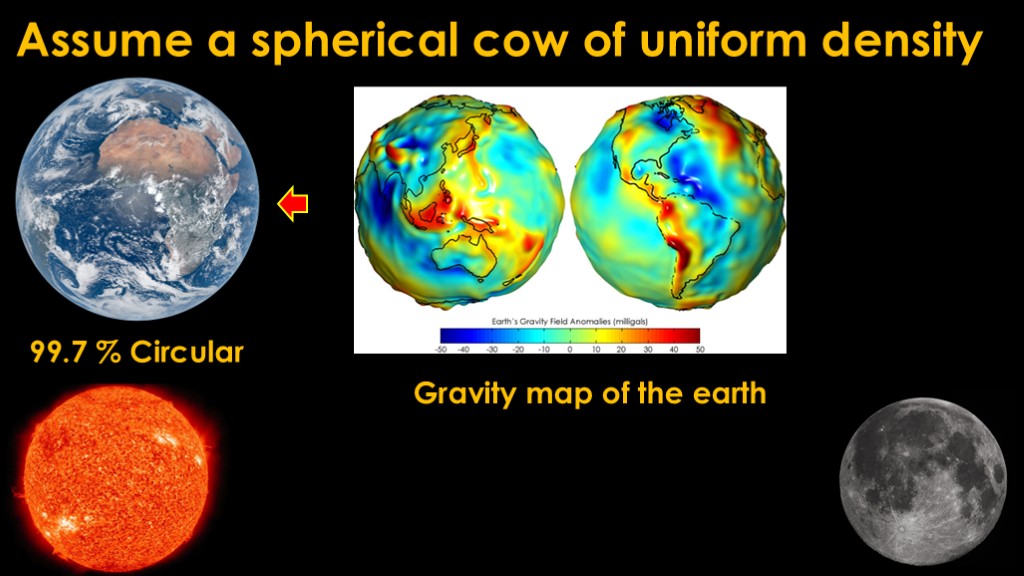
The earth is pretty close to a perfect sphere, being 99.7% circular. It's an oblate spheroid, with a slight bulge at the equator and a little flat at the poles. The earth also is not of uniform density, and that means that the gravity over one part of the earth may be higher than over other parts of the earth. These are small effects, but more sophisticated predictive models do take them into account.
And the sun and the moon also have a gravitational influence on the object, changing its orbit.
These factors - plus a few others I've skipped over - mean that it's hard to get good predictions of the position of objects and therefore it's hard to identify possible conjunctions that are a week away.
That is why it is so important to have continuous updates of tracked objects, so you know that your predictions are for as short of a period as possible.
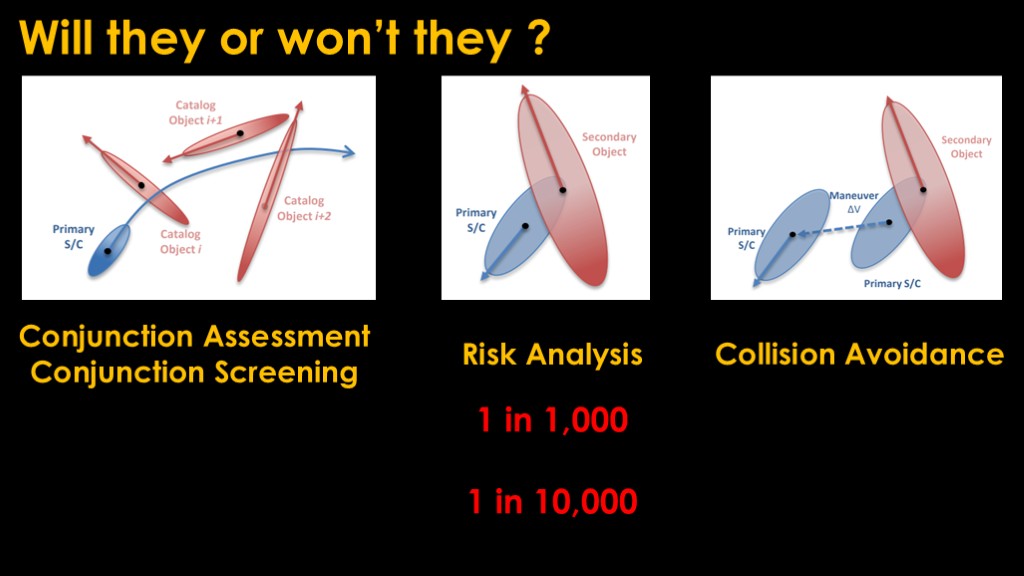
With the predicted paths of all the objects, we can get to the important part.
The first step is conjunction assessment or conjunction screening. It basically calculates the paths of all objects and then looks to see if there are cases where there might be a conjunction.
The second step is risk analysis that looks at how likely a collision is. In this diagram, the objects are the black dots and the ellipses represent the amount of uncertainty in the location of the satellite that exists based on the factors I discussed. The evaluation is something like "does the range of possible locations for the primary object intersect with the range of possible locations for the secondary object"
The analysis spits out a probability of there being a collision. For NASA if the risk is higher than 1 in 1,000 for robotic spacecraft, they will move the spacecraft, and if its a crewed vehicle, if the risk threshold is greater than 1 in 10,000.
If the threshold is exceeded, a maneuver is planned to move one of the objects enough to reduce the chance of the collision below the threshold.
There is not surprisingly a lot of math going on here and a lot of research to make the process more efficient. This becomes more important as orbital objects proliferate.
And that's all for part 4.
Next time we'll be talking about what might be done to clean up this mess.

Today's song is Space Junk, off of Devo's 1978 album "Are we not men? We are devo"
https://www.youtube.com/watch?v=Z2dcVIEQwEE